

Charleston vs Nashville: Which STR Market Wins in 2026?


Charleston generally produces higher revenue per listing for well-located, licensed properties, while Nashville offers more predictable year-round occupancy and an easier regulatory path for new investors. The right answer depends on your capital, risk tolerance, and how much time you can spend navigating permits. At Maverick STR, we manage properties in both cities and see this exact question from investors every week.
Key Takeaways
Charleston's average daily rate reaches roughly $429 with 50.6% occupancy and about $67,077 in average annual revenue per listing, according to recent Airbnb market data covering July 2026 through June 2026.
Nashville runs a more forgiving occupancy pattern, with market-wide occupancy historically in the 42% to 46.5% range in 2025-2026 per AirROI and RentPermitted data, though listings averaged around $40,500 to $43,117 in trailing annual revenue.
Charleston is classified as a "Restricted" STR market by STRRequirements, with permit costs of $250 (24-72 nights/year) or $1,500 (72+ nights/year) plus a $200 zoning fee; combined local and state taxes run near 14%.
Nashville is classified "Legal but Limited," with a lower $313 permit fee and a 6% Short-Term Rental Property Tax, but civil penalties for unpermitted operation can climb as high as $500,000 for repeat violations.
Charleston's top 10% of listings earn $15,413+ per month, while the median Charleston listing earns roughly $5,758 per month, showing how much performance depends on location and pricing strategy rather than the city alone.
Nashville welcomed record tourism and business travel volume through 2026 into 2026, supporting occupancy near 70-80% for well-managed downtown-adjacent properties, according to industry benchmarking sources.
Both cities rank among the most searched short-term rental markets in the Southeast, and for good reason. Charleston's historic peninsula and coastal draw pull in over 7.9 million visitors annually as of 2026, while Nashville's mix of music tourism, bachelorette travel, and corporate relocation keeps demand steady across most of the calendar year. As of 2026, both markets have matured past their early "wild west" Airbnb phase into more regulated, competitive environments.
This comparison isn't about crowning an overall winner. It's about matching the right market to your specific goals, whether that's maximizing peak-season revenue in a coastal tourist zone or building a dependable, lower-volatility cash flow property near a growing metro's entertainment core. We'll walk through the real numbers on revenue, regulation, taxes, and neighborhood selection so you can make the call with your eyes open.
By the end, you'll understand not just which city has higher averages, but which one actually fits how you plan to operate: hands-on or hands-off, full-time host or long-distance investor, single property or growing portfolio.
How Do Charleston and Nashville Compare on Revenue and Occupancy?
Charleston generates higher average revenue per listing than Nashville, but Nashville delivers more consistent occupancy across the calendar year. Charleston's average annual revenue per listing sits near $67,077 with a $429 ADR and 50.6% occupancy, according to Airbnb market data covering mid-2025 through mid-2026. Nashville's average annual revenue lands closer to $40,500 to $43,117, per AirDNA and AirROI figures from the same period.
The gap comes down to pricing power, not booking volume. Charleston hosts charge significantly more per night, largely because the peninsula's historic housing stock and beach proximity create scarcity that Nashville's larger, more elastic supply doesn't replicate. Nashville has roughly 13,889 to 15,600 active listings depending on the data source and month, compared to Charleston's tighter pool of about 1,955 active listings.
Nashville's occupancy, however, tends to run steadier. Some industry benchmarking sources report urban Nashville properties near entertainment districts hitting 70-80% occupancy year-round, which is meaningfully higher than Charleston's blended 50.6% market average. This means Nashville properties often turn over guests more consistently, even if nightly rates run lower.
The practical takeaway: if you want fewer vacant nights and more predictable cash flow, Nashville's occupancy pattern is easier to plan around. If you can secure a well-located Charleston property and can absorb some off-season softness, the ADR advantage can outweigh the occupancy gap. Neither number tells the full story alone, which is why we built the comparison table below.
What Do the Actual Numbers Say in a Side-by-Side Comparison?
A direct comparison of Charleston and Nashville STR metrics shows Charleston winning on revenue per listing while Nashville wins on entry cost and permit accessibility. The table below pulls from AirDNA, AirROI, RentPermitted, and STRRequirements data collected through 2026.
Metric | Charleston, SC | Nashville, TN |
Average Daily Rate (ADR) | $429-$463 | $358-$363 |
Market-Wide Occupancy | 50.6%-60% | 42%-46.5% |
Average Annual Revenue/Listing | $54,600-$67,077 | $35,625-$43,117 |
Active STR Listings | ~1,955 | 13,889-15,600 |
AirDNA Market Score | 89/100 | 80/100 |
Median Home Purchase Price | $349,000-$488,200 | $264,600-$527,225 |
STR Permit Fee | $250-$1,500 + $200 zoning | $313 |
Combined STR Tax Rate | ~14% | 6% + state/local sales tax |
Regulatory Classification | Restricted | Legal but Limited |
Notice the AirDNA Market Score gap: Charleston's 89 out of 100 outpaces Nashville's 80, largely reflecting Charleston's stronger revenue-per-listing performance. But market score alone doesn't account for how much harder Charleston's permitting process can be for a new entrant, a point we'll unpack next.
Which City Has Easier STR Regulations for New Investors?
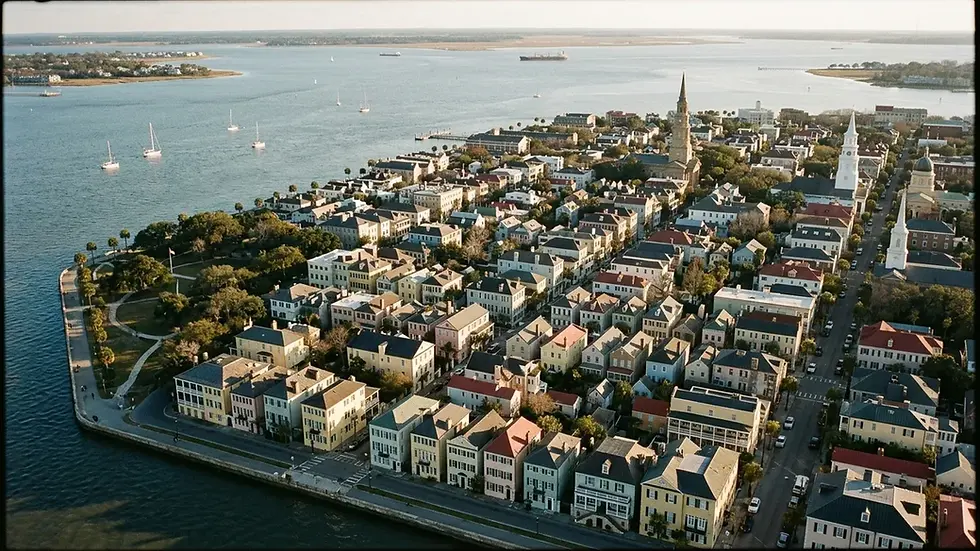
Nashville's regulatory framework is generally easier for a first-time STR investor to navigate, while Charleston's permitting process involves more zoning scrutiny despite a lower base permit fee tier. STRRequirements classifies Nashville as "Legal but Limited," meaning permits are available but capped or zoned in specific areas, while Charleston carries a "Restricted" designation with tighter approval requirements, particularly on the peninsula.
Charleston's permit structure charges $250 for operators renting 24 to 72 nights per year, or $1,500 for those renting more than 72 nights annually, plus a separate $200 zoning review fee. According to AirROI's 2026 dataset covering Charleston's 1,955 active listings, the source found no licensed listings among those it analyzed, suggesting a meaningful share of the current market may be operating ahead of, or outside, formal compliance. That's a red flag for investors who assume "everyone else is doing it" is a safe strategy.
Nashville's permit fee runs a flat $313, plus a 6% Short-Term Rental Property Tax on top of standard state and local sales tax. Operating without a permit in Nashville carries a $50 daily fine, and civil penalties for repeat violations can reach $500,000, which is a serious deterrent against ignoring the rules. Metro Nashville's zoning maps also distinguish between owner-occupied and non-owner-occupied STR permits, so confirm which category applies before you buy.
Charleston has also partnered with Bloomberg Associates as of May 2026 to help shape a longer-term responsible tourism and zoning strategy, and the city was actually the first in the U.S. to adopt a formal tourism management plan back in 1978, updated again in 1994, 2015, and now under review heading into 2026. That history signals Charleston is unlikely to loosen restrictions anytime soon; if anything, expect more structure, not less.
Before closing on a property in either market, verify current permit caps and zoning maps directly with Charleston's or Metro Nashville's planning offices. Regulations shift, and relying on outdated blog posts (including this one, eventually) is a mistake experienced investors avoid.
What Does It Actually Cost to Buy an STR in Each Market?
Nashville offers a lower median entry price for STR acquisition, while Charleston's entry cost sits higher but correlates with stronger rental income potential. Charleston's median purchase price ranges from roughly $349,000 to $488,200 depending on the data source and neighborhood mix, while Nashville's median ranges from about $264,600 to $527,225, a wider spread reflecting Nashville's more varied submarkets from Antioch to Belle Meade.
Long-term rent comparisons add useful context for investors weighing STR against traditional buy-and-hold strategies. Charleston's median monthly long-term rent runs between $1,318 and $1,959, while Nashville's median lands between $1,170 and $1,782. In both cities, the gap between what a property earns as a long-term rental versus a licensed short-term rental is substantial, often two to three times the monthly revenue, assuming reasonable occupancy.
Financing considerations matter here too. Charleston metro's single-family rental average has climbed to approximately $2,750 per month, about 60% above the national average, according to Palmetto State Properties data. That single-family rental strength suggests Charleston's housing market is tightening broadly, not just in the STR segment, which can compress future acquisition opportunities if you wait too long to buy.
For investors weighing a 1031 exchange into either market, note that specific eligibility rules and timelines are set by federal tax code and can change. Always confirm current requirements with a qualified intermediary or CPA rather than relying on general guidance in an article like this one.
Which Neighborhoods Actually Perform Best in Each City?
Charleston's strongest STR neighborhoods cluster around Downtown, South of Broad, and Harleston Village, where historic housing stock and walkability to King Street command premium nightly rates. Nashville's top-performing zones center on Music Row, The Gulch, and East Nashville, each offering a distinct mix of proximity to Broadway, walkability, and neighborhood character that shapes guest demand differently.
Charleston: Downtown, South of Broad, and Harleston Village
These three neighborhoods dominate Charleston's arbitrage and ownership conversations because they combine tourist foot traffic with the single-family and carriage-house inventory that photographs well and books at a premium. South of Broad in particular carries strict architectural review requirements given its historic district status, meaning renovation costs and permit timelines run longer than in newer Charleston submarkets like West Ashley or Johns Island. That's a tradeoff: higher ADR potential against slower renovation and stricter oversight.
Nashville: Music Row, The Gulch, and East Nashville
Music Row properties benefit from proximity to both downtown Broadway and the business district, with some industry sources citing monthly revenue above $5,000 for well-positioned units. The Gulch offers a denser, more modern condo stock that appeals to business travelers and couples rather than large bachelorette groups. East Nashville, by contrast, draws a different crowd entirely: creative-class travelers who want walkability to local coffee shops and independent restaurants rather than Broadway's honky-tonk scene.
One nuance most comparison articles skip: noise and nuisance complaints hit Music Row and downtown Nashville harder than East Nashville, simply because Music Row properties sit closer to bachelorette and bachelor party demand. If you're managing a property remotely, that proximity to nightlife cuts both ways, higher booking demand but also a higher volume of guest-behavior complaints that require fast response. Charleston's South of Broad carries a comparable dynamic, where historic district neighbors have less tolerance for noise than newer, less dense pockets of the peninsula.
How Does Seasonality Affect Annual Returns in Each Market?
Charleston's STR revenue swings more dramatically by season than Nashville's, with peak spring months generating nearly double the revenue of the slowest winter months. Charleston's peak season, covering March through May, averages $10,169 in monthly revenue at 61.7% occupancy and a $487 ADR. The slowest months, January, September, and December, average just $5,547 in monthly revenue at 45.6% occupancy.
Nashville's demand curve is flatter but still event-driven. Annual events like CMA Fest in June and the ongoing concert calendar at Bridgestone Arena create predictable demand spikes that experienced hosts price around rather than treat as a bonus. Unlike Charleston's broad seasonal wave tied to weather and garden tourism, Nashville's spikes are calendar-specific and easier to plan against months in advance.
This is exactly where most published comparisons fall short. They quote an annual average and stop there, without acknowledging how much of that average gets built on a handful of peak weeks. A Charleston host who prices flat year-round is leaving significant peak-season revenue on the table in March through May, while a Nashville host who ignores CMA Fest week is doing the same thing on a smaller scale. Dynamic, event-aware pricing closes that gap in both markets, and it's the single biggest lever most self-managed hosts underuse.
At Maverick STR, our revenue management team builds pricing calendars around these exact demand curves, adjusting rates ahead of Charleston's spring surge and Nashville's event calendar rather than reacting after occupancy has already dropped. One Nashville property we manage was projected to do $60,000 in its first year; with dynamic pricing and demand-based calendar adjustments, it closed the year at $100,000 instead.

Which Market Fits Different Types of Investors Better?
Charleston tends to fit experienced operators with more capital and tolerance for regulatory complexity, while Nashville suits first-time investors and those prioritizing steadier occupancy over peak revenue ceilings. This isn't a universal rule, but it reflects the practical realities of each market's entry costs, permit friction, and seasonal volatility.
First-time hosts: Nashville's lower permit fee and more straightforward "Legal but Limited" classification make it easier to get licensed and operating without months of zoning delays.
Out-of-state owners: Both cities work for remote ownership if you partner with local co-hosting or full-service management, since neither market rewards absentee owners who try to self-manage guest communication and turnovers from another state.
Real estate investors comparing markets: Charleston's higher ADR ceiling rewards investors who can afford a premium South of Broad or Downtown property and want maximum revenue per unit, even with fewer nights booked.
Multi-property investors: Nashville's larger, more affordable inventory across submarkets like Antioch, East Nashville, and Franklin makes portfolio scaling more capital-efficient than Charleston's tighter, pricier peninsula market.
Second home owners: A Charleston property doubling as a personal getaway benefits from the spring peak season aligning with typical vacation windows, while a Nashville property benefits from more consistent rentability if you only visit occasionally.
If you're still weighing Charleston against Nashville for your specific financial situation, that's a conversation worth having with someone who has actual operating data from both markets, not just published averages. Maverick STR's STR consulting team works through the numbers with investors deciding between the two, using real performance data from properties we manage rather than generic market reports.
What Tools Should You Use to Verify These Numbers Yourself?
Independent verification of any market comparison is essential before committing capital, and several established tools let you sanity-check ADR, occupancy, and revenue data for specific addresses or neighborhoods. AirDNA remains the most widely cited source for market score, ADR, and occupancy benchmarking across both Charleston and Nashville. PriceLabs offers granular, address-level revenue projections useful for underwriting a specific property rather than relying on citywide averages.
STRRequirements.com is the best resource for confirming current permit classifications and regulatory status, since zoning rules change more frequently than most investors expect. Before you rely on any secondhand comparison, cross-reference the specific submarket and property type against these primary sources, since a citywide average can mask significant block-by-block variation, particularly in Charleston's historic district.
For hosts already operating and wondering whether their current pricing captures full seasonal upside, our guide on key revenue management strategies breaks down the specific levers that move occupancy and ADR independently, which matters more in a seasonal market like Charleston than in Nashville's flatter demand curve.
Practical Guidance: How Should You Choose Between Charleston and Nashville?
Choosing between Charleston and Nashville comes down to matching your capital, timeline, and management style to each market's actual performance profile rather than picking based on which city sounds more exciting to own property in. Here's a practical framework for making that decision.
Start with your budget ceiling. If you're working with under $350,000, Nashville's broader submarket selection gives you more options than Charleston's tighter, pricier peninsula inventory.
Confirm permit availability before you make an offer. Charleston's "Restricted" classification means some zones may already be at capacity; verify directly with the city's planning office rather than assuming approval.
Model your cash flow using tiered performance data, not the citywide average. A median Charleston listing earns roughly $5,758/month, while a top 10% listing earns $15,413+, a gap wide enough to make or break your underwriting.
Factor in your tolerance for seasonal volatility. Charleston's peak-to-trough swing is steeper than Nashville's, which matters if you need consistent monthly cash flow to cover a mortgage.
Decide how hands-on you want to be. If you're not local to either market, budget for professional co-hosting or full-service management from day one rather than assuming you'll self-manage successfully from a distance.
Avoid the common mistake of pricing flat year-round. Whichever city you choose, dynamic, event-aware pricing is what separates median performers from top-tier ones in both markets.
The biggest mistake we see new investors make isn't picking the "wrong" city. It's assuming the citywide average will apply to whatever property they buy, without verifying neighborhood-level performance, permit status, and realistic operating costs first.
Frequently Asked Questions
Is Charleston or Nashville a better market for short-term rental investment?
Charleston generally produces higher average revenue per listing, near $67,077 annually according to recent Airbnb data, while Nashville offers steadier occupancy and easier permitting. The better market depends on your budget, risk tolerance for seasonal swings, and comfort navigating Charleston's more restrictive zoning process.
Which city has stricter short-term rental regulations, Charleston or Nashville?
Charleston carries a "Restricted" STR classification with tighter zoning enforcement, particularly in historic districts like South of Broad. Nashville is classified "Legal but Limited," which generally makes permit approval more predictable, though penalties for unpermitted operation can still reach up to $500,000 for repeat violations.
How much does an STR permit cost in Charleston versus Nashville?
Charleston charges $250 for 24 to 72 rental nights per year or $1,500 for over 72 nights, plus a $200 zoning review fee. Nashville charges a flat $313 permit fee, plus a 6% Short-Term Rental Property Tax on top of standard sales tax.
What is the average Airbnb revenue in Charleston compared to Nashville?
Charleston listings average roughly $54,600 to $67,077 in annual revenue depending on the data source and time period, while Nashville listings average closer to $35,625 to $43,117 annually. Charleston's higher ADR, near $429 versus Nashville's roughly $360, drives most of that revenue gap despite Nashville's higher occupancy.
Which Charleston and Nashville neighborhoods perform best for short-term rentals?
In Charleston, Downtown, South of Broad, and Harleston Village consistently rank as top-performing STR zones due to walkability and historic housing appeal. In Nashville, Music Row, The Gulch, and East Nashville each attract different guest profiles, from business travelers to bachelorette groups to creative-class visitors.
Does a 1031 exchange work for short-term rental properties?
A 1031 exchange can apply to certain short-term rental properties depending on how the property is used and current federal tax rules, but eligibility requirements are specific and change periodically. Always consult a qualified intermediary or CPA to confirm your property qualifies before pursuing an exchange between Charleston and Nashville assets.
How does seasonality affect returns in Charleston versus Nashville?
Charleston shows sharper seasonal swings, with peak spring months (March through May) generating nearly double the revenue of slow winter months. Nashville's demand curve is flatter overall but includes sharp, predictable spikes tied to specific events like CMA Fest and the Bridgestone Arena concert calendar.
Should a first-time investor choose Charleston or Nashville?
First-time investors often find Nashville easier to enter due to its lower permit fee, broader inventory of affordable submarkets, and more forgiving "Legal but Limited" regulatory classification. Charleston can still work for first-time investors with sufficient capital, but the permitting process and premium entry prices favor more experienced operators.
Conclusion: Charleston or Nashville, Which Should You Choose in 2026?
Charleston delivers higher revenue ceilings for investors who can navigate its restricted permitting environment and absorb steep seasonal swings, while Nashville rewards investors who want steadier occupancy, lower entry costs, and a more forgiving regulatory path. Neither city is objectively "better" for short-term rental investment. The right choice depends on your capital, your tolerance for seasonal cash flow variation, and how much bandwidth you have to manage compliance.
As of 2026, both markets continue to mature past their earlier, looser regulatory phases, and that trend is unlikely to reverse. Investors who treat permit compliance and dynamic pricing as core strategy, rather than afterthoughts, are the ones consistently outperforming citywide averages in both cities.

If you're weighing Charleston against Nashville for your next short-term rental purchase, or already own in one of these markets and suspect you're underperforming, Maverick STR can walk through the real numbers with you. Our clients typically perform in the 90th percentile for their market, and properties we manage often outperform market averages by 50% or more. Whether you need full-service management, revenue optimization, or a straight answer on which city fits your goals, reach out through our site to start the conversation.
Written by Chase Gillmore, Owner & Operator at Maverick STR
Content powered by inkSTR.co


Comments