

How Much Can I Make on Airbnb in Charleston in 2026?


Charleston Airbnb hosts earned an average of $65,541 to $74,000 in annual revenue as of 2026, depending on the data provider and property type, with occupancy rates ranging from roughly 49% to 74%. At Maverick STR, we manage properties in Charleston, SC and Nashville, TN, and the honest answer to "how much can I make on Airbnb in Charleston" is: it depends far more on your submarket, pricing strategy, and management approach than any single average can capture.
Key Takeaways
AirDNA reports Charleston short-term rentals averaged 65% occupancy and $254 RevPAR for the year ending May 2026, with occupancy up 5.0% year over year.
Revenue estimates vary widely by source: Airbtics reports a $74,000 median annual revenue, while AirROI reports $65,541 to $67,191, and AirDNA's overview lists $58,300.
Submarket matters more than city-wide averages. Occupancy ranges from 33.2% on Kiawah Island to 53.3% in Mount Pleasant and James Island.
Top 10% performing Charleston listings earn at least $15,041 per month, compared to roughly $5,601 for median properties and $2,743 for the bottom quartile, per AirROI's performance tiers.
Professional revenue management, using tools like PriceLabs alongside real-time market data, typically delivers 20 to 40% higher annual revenue than self-managed pricing.
Charleston's active short-term rental supply declined 9.9% year over year through May 2026 even as occupancy and RevPAR both grew, according to AirDNA.
If you're weighing whether a Charleston property can generate meaningful income in 2026, you're not alone. Charleston welcomed 7.91 million overnight visitors in 2026 and generated $14.35 billion in regional tourism economic impact, according to the College of Charleston Office of Tourism Analysis. That demand is real, but converting it into consistent Airbnb revenue requires understanding exactly where and how you operate.
This guide compares the major data sources tracking Charleston short-term rental income and walks through what actually drives the gap between a listing earning $30,000 a year and one earning $90,000. You'll also get a framework for estimating your own property's realistic revenue range, plus the licensing and submarket factors most revenue guides skip entirely.
The short-term rental data industry pulls from different samples, date ranges, and definitions, so no single number tells the whole story. We'll show you how to read these figures like an analyst instead of taking any one headline stat at face value.
How Much Does the Average Charleston Airbnb Actually Make?
The average Charleston Airbnb generates between $58,300 and $74,000 in annual revenue, depending on which market data provider you reference, as of 2026. This spread exists because AirDNA, Airbtics, and AirROI use different listing samples, date windows, and occupancy definitions, so treating any single figure as gospel is a mistake.
AirDNA's Charleston overview lists $58,300 in annual revenue, a $381.10 average daily rate, and $242.30 RevPAR, each showing year-over-year growth. Separately, AirDNA's seasonality data reports 65% average occupancy and $254 RevPAR for the trailing year through May 2026.
Airbtics, by contrast, reports a $74,000 median annual revenue across 1,848 active Charleston listings, with 74% median occupancy and a $266 average nightly rate for the February 2026 through January 2026 period. That's a meaningfully higher occupancy figure than AirDNA's, largely because Airbtics and AirDNA sample different listing pools and calculate occupancy differently. AirROI splits the difference, estimating $65,541 to $67,191 in average annual revenue for Charleston using data from mid-2025 through mid-2026, with 48.9% to 65.2% occupancy and ADR figures between $284 and $432 depending on the specific report referenced.
AirDNA's own reports show occupancy figures at the higher end of the range as well: Airbtics' 46% occupancy alongside $481 nightly rates in one analysis would translate to roughly $93,000 in average annual revenue, the high end of the entire range we're discussing here. That illustrates how much methodology changes the headline number.
What Is the 80/20 Rule for Airbnb?
The 80/20 rule as commonly applied to Airbnb hosting suggests that roughly 20% of your listings, amenities, or guest touchpoints tend to drive around 80% of your revenue or guest satisfaction outcomes. In Charleston specifically, this shows up most clearly in submarket selection and pricing strategy rather than in any single amenity.
For example, an updated kitchen, reliable WiFi, and flexible check-in tend to influence booking conversion far more than dozens of smaller decorative touches combined. Similarly, a minority of nights on your calendar (weekends, festival dates, spring weeks) typically generate a disproportionate share of annual revenue.
Applied to Charleston's data, this concept explains why AirROI's performance tiers show such a wide gap: top 10% properties earn at least $15,041 per month, while median properties earn closer to $5,601 monthly. That gap isn't random. It usually traces back to submarket location and pricing responsiveness during peak demand, the exact areas where a small number of decisions drive most of the outcome. This is precisely where dynamic pricing tools and hands-on revenue management earn their keep, because they concentrate effort on the variables that actually move the needle.

Is Charleston a Good Place for Airbnb in 2026?
Charleston remains a strong short-term rental market in 2026, supported by steady tourism growth and relatively consistent year-round demand compared to more seasonal coastal markets. AirDNA assigns Charleston a Rental Demand subscore of 87 out of 100 and an overall Market Score of 92, both signs of healthy underlying fundamentals.
Tourism data backs this up. Charleston's regional tourism economy grew from $10.62 billion in 2021 to $14.35 billion in 2026, according to the College of Charleston Office of Tourism Analysis, while average adult visitor spending rose 9.7% year over year to $1,212 per trip. Charleston International Airport handled 6.34 million passengers in 2026, and hotel occupancy averaged 70.6% in 2026, confirming that accommodation demand extends well beyond the short-term rental sector.
What makes Charleston notable compared to many beach-driven markets is its seasonality score of 71 out of 100 on AirDNA's scale, indicating flatter year-round demand than you'd find in a purely summer-driven destination. Spring, specifically March through May, is the strongest stretch, averaging $9,920 in monthly revenue and 59.5% occupancy in one dataset, while January, September, and December run weaker at roughly $5,742 monthly.
The complication is supply. Active listings declined 9.9% year over year through May 2026 even as occupancy and RevPAR both climbed, according to AirDNA. That's a sign of tightening regulation and licensing caps in several submarkets, which we'll cover next, not necessarily softening demand.
Are Airbnbs Still Profitable in 2026?
Yes, Airbnb properties in Charleston can still be profitable in 2026, but profitability depends heavily on your entry costs, financing terms, and operating expenses, not just gross revenue. A property showing $70,000 in gross annual revenue can still lose money if you don't model mortgage payments, insurance, and turnover costs realistically before purchase.
One modeled example of a typical three-bedroom Charleston short-term rental shows $71,800 in gross annual revenue, based on a $298 nightly rate and 241 booked nights (66% occupancy). After modeled operating costs, roughly $48,824 remains, implying approximately $22,976 in annual operating expenses before mortgage payments, taxes, or financing costs are factored in.
That expense figure typically covers cleaning and turnover fees, utilities, supplies, platform fees, insurance, and routine maintenance. It doesn't include your mortgage or any renovation debt, which is where many first-time hosts underestimate their true break-even point. A property that looks profitable on a gross revenue chart can post a loss once financing is added back in, especially on properties purchased above asking price in competitive submarkets like Mount Pleasant or Isle of Palms.
From what we see managing properties in Charleston, the owners who struggle with profitability almost never have a demand problem. They have a pricing and expense-tracking problem. Static nightly rates set once and left alone consistently underperform properties using dynamic pricing tied to real-time demand signals, and that gap compounds every month you leave it unaddressed.
How Should You Balance Occupancy and Nightly Rate in Charleston?
There's no fixed formula that tells you the "right" ratio between occupancy and nightly rate for a Charleston Airbnb. What matters is understanding your specific property's occupancy-to-rate tradeoff using your own market's real data, then pricing to maximize revenue rather than chasing occupancy or rate as separate goals.
Look at verified benchmarks instead. AirROI's Charleston performance tiers show top-25% properties command nightly rates of at least $465, while bottom-25% properties sit around $163 per night. Median properties land near $284 nightly with 65.2% average occupancy, according to AirROI's broader Charleston report.
The practical takeaway: chasing a single fixed ratio between occupancy and rate misses how much submarket, seasonality, and property size actually drive outcomes. A one-bedroom Charleston unit at $258 per night behaves completely differently than a four-bedroom property averaging $898 per night. Build your pricing strategy around your specific property type and location instead of applying a borrowed formula from an unrelated market.
Charleston Data Sources Compared: Why the Numbers Don't Match
Charleston short-term rental revenue estimates vary by as much as $16,000 annually between data providers because each source samples different listings, date ranges, and defines occupancy differently. Understanding these differences helps you interpret any revenue figure, including the ones in this article, more critically.
Data Source | Period | Avg. Annual Revenue | Occupancy | Avg. Daily Rate |
AirDNA (overview) | 2026 | $58,300 | Not specified in overview | $381.10 |
AirDNA (seasonality) | May 2026 to May 2026 | Implied via RevPAR ($254) | 65% | Not specified |
Airbtics | Feb 2026 to Jan 2026 | $74,000 (median) | 74% (median) | $266 |
AirROI (report) | Aug 2026 to Jul 2026 | $65,541 | 48.9% | $432 |
AirROI (broader report) | 2026 | $67,191 (median) | 65.2% | $284 (median) |
AirROI (submarket breakdown) | Jun 2026 to May 2026 | $65,541 | 48.9% | $432 |
Airbtics (high-end estimate) | 2026 | ~$93,000 | 46% | $481 |
AirDNA's own two reports (its overview page and its seasonality page) don't fully agree with each other, which underscores the point: no single "Charleston average" exists. Use these figures as a range, roughly $58,000 on the conservative end to $93,000 on the aggressive end, and validate against your specific submarket and property type before making any purchase or pricing decision. This is exactly the kind of analysis our team walks through with owners considering Charleston property management for the first time.
How Does Revenue Vary by Charleston-Area Submarket?
Charleston-area short-term rental revenue varies dramatically by submarket, with occupancy ranging from 33.2% on Kiawah Island to 53.3% in Mount Pleasant and James Island as of 2026, according to AirROI's submarket data. Choosing the right submarket matters more than almost any other single decision you'll make as a host.
Submarket | Occupancy | Regulatory Notes | Est. Annual Revenue |
Mount Pleasant / James Island | 53.3% | 400-unit cap; 2026 renewals closed | ~$55,000 |
Charleston (city average) | 48.9% | Occupancy limits reportedly apply; verify with the city | $65,541 |
Folly Beach | 45.7% | 800-unit cap with waitlist | ~$86,000 to $109,000 |
Sullivan's Island | 42.7% | Restrictive local rules | Not specified |
Isle of Palms | 41.7% | No cap; business license required | ~$87,000 to $132,000 |
Johns Island | 39.7% | Less restrictive than beach communities | Not specified |
Seabrook Island | 34.4% | Gated community rules apply | Not specified |
Kiawah Island | 33.2% | Gated community rules apply | Not specified |
The pattern here is counterintuitive at first glance: lower occupancy submarkets like Isle of Palms and Folly Beach show higher estimated annual revenue than higher-occupancy Mount Pleasant. That's because these beach communities command significantly higher nightly rates, offsetting fewer booked nights. Occupancy alone tells you almost nothing about profitability without pairing it against average daily rate.
Licensing caps also materially restrict new supply in several of these areas. Mount Pleasant's 400-unit cap closed 2026 renewals, and Folly Beach maintains an 800-unit cap with an active waitlist. Before assuming you can simply list a property in any of these zones, verify current permit availability directly with the applicable local licensing office, since caps and waitlists shift over time.
How Do You Build a Realistic Gross-to-Net Revenue Estimate?
A realistic gross-to-net Airbnb revenue estimate starts with your projected nightly rate and occupancy, then systematically subtracts every operating cost before arriving at true profit. Most Charleston market reports stop at gross revenue, which is why so many first-time hosts overestimate what they'll actually keep.
Start with the top line: multiply your expected average daily rate by your projected occupancy and 365 days. Using the three-bedroom Charleston model referenced earlier, $298 per night at 66% occupancy yields roughly $71,800 in gross annual revenue.
From there, subtract these cost categories individually, rather than lumping them into one vague "expenses" line:
Cleaning and turnover fees: Charged per stay, often passed through to guests but still requiring your operational coordination and quality control.
Platform and payment processing fees: Airbnb and VRBO both charge host-side service fees on top of guest-side fees.
Utilities and internet: Higher than a typical owner-occupied home due to guest usage patterns and required amenities.
Supplies and consumables: Linens, toiletries, coffee, and replacement items that wear out faster with turnover frequency.
Insurance: Short-term rental-specific coverage, typically higher than standard homeowner's insurance.
Property taxes: Often assessed differently for investment or short-term rental use than owner-occupied property, so confirm your specific rate with the county assessor.
Maintenance and repairs: Budget for wear and tear from frequent guest turnover, not just occasional homeowner-style upkeep.
Management fees, if applicable: Full-service management typically runs 15 to 30% of gross booking revenue, while co-hosting arrangements typically run 10 to 18%.
In this worked example, these combined costs total approximately $22,976 annually, leaving around $48,824 before mortgage payments or financing costs. That remaining figure, not the initial $71,800 headline, is the number that should drive your purchase or investment decision.

What Drives the Gap Between Median and Top-Performing Charleston Listings?
The gap between median and top-performing Charleston Airbnb listings comes down to pricing responsiveness and property positioning within the right submarket. AirROI's data shows top 10% Charleston properties earning at least $15,041 monthly, compared to roughly $5,601 for median listings, a gap too large to explain by luck alone.
Pricing responsiveness separates winners from average performers first and foremost. A 2026 study across 541 Airbnb listings in 34 countries found that properties using dynamic pricing saw an average 36.3% increase in gross revenue per unit and a 37.3% increase in nights booked per unit, according to research published via PriceLabs and Your.Rentals. Static, "set it and forget it" pricing consistently leaves that revenue on the table.
Listing presentation matters more than most first-time hosts assume. Photography quality, title structure, and amenity descriptions directly influence conversion rate, meaning two nearly identical properties can perform very differently based on how well the listing is optimized. This is a service area we handle directly for clients through Maverick STR's listing optimization work.
Professional management access also typically outperforms self-management. Industry data suggests professional STR management delivers 20 to 40% higher annual revenue than self-management, primarily through dynamic pricing and occupancy optimization rather than simply "doing more work." One property we brought on, projected to do around $60,000 in its first year under previous management, ended up generating closer to $100,000 once we addressed pricing strategy, listing presentation, and demand-based calendar management together.
What Should You Verify Before Buying or Listing a Charleston Airbnb?
Before buying or listing a Charleston short-term rental, verify current permit availability, occupancy limits, and business license requirements directly with the applicable city or county office, since regulations and caps change and vary meaningfully by submarket. Skipping this step is the most common and costly mistake we see new investors make.
Follow this sequence:
Confirm the property's zoning and submarket rules. Mount Pleasant, Folly Beach, and Charleston proper each have different caps, waitlists, or license requirements, as shown in the submarket table above.
Check current permit or license availability with the relevant city or county licensing office before assuming you can operate legally once you close on the property.
Model gross-to-net revenue, not just gross revenue, using the expense categories outlined earlier in this article.
Compare at least two independent revenue data sources (AirDNA, Airbtics, AirROI) for the specific submarket, not just city-wide Charleston averages.
Evaluate your financing terms against modeled net income, not against the optimistic gross revenue figure often shown in listing marketing materials.
Decide your management approach early: self-managing, co-hosting, or full-service management each carry different cost structures and time commitments.
Relying on a single data source's revenue estimate is a common and costly mistake. So is underestimating turnover and maintenance costs, or assuming a submarket's licensing rules today will remain unchanged next year. Charleston's active listing supply already dropped 9.9% year over year through May 2026, a clear signal that regulatory tightening is an ongoing trend, not a one-time event.
If you're deciding between managing the property yourself or bringing in outside help, it's worth reading through how co-hosting compares to full-service management before committing to either path, since the right answer depends heavily on how hands-on you want to be.
Frequently Asked Questions
How much can I make on Airbnb in Charleston per month?
Monthly Charleston Airbnb revenue typically ranges from about $2,743 for bottom-quartile properties to $5,601 for median properties, and at least $15,041 for top 10% performers, according to AirROI's performance-tier data. Your specific number depends heavily on submarket, bedroom count, and pricing strategy.
How does Charleston Airbnb management services work?
Charleston Airbnb management typically covers pricing strategy, guest communication, cleaning coordination, and listing optimization, with full-service management usually charging 15 to 30% of gross booking revenue and co-hosting arrangements typically running 10 to 18%. At Maverick STR, we combine dynamic pricing with hands-on local support across Charleston rather than offering a single bundled service with no flexibility.
Is Charleston or Nashville a better market for short-term rental investment?
Both markets have strong fundamentals, but they behave differently. Charleston shows steadier year-round demand with a seasonality score of 71 out of 100, while Nashville's demand is more event-driven around specific calendar dates. The better choice depends on your investment goals, budget, and how each city's licensing environment fits your risk tolerance.
Which PMS integrations allow for rule-based pricing across Airbnb, VRBO, and Booking.com?
Most professional short-term rental operators use dynamic pricing tools like PriceLabs integrated with a property management system such as Guesty, Hostaway, or Lodgify to sync rule-based pricing across Airbnb, VRBO, and Booking.com simultaneously. This multi-platform distribution has become the standard expectation for professional STR management as of 2026.
Will SEO help me rank higher than Airbnb and Booking.com?
A well-optimized direct booking website with dedicated vacation rental SEO can rank in search results alongside or ahead of individual OTA listings for branded and long-tail searches, though it generally won't outrank Airbnb's own domain for broad category terms. The real value is capturing commission-free direct bookings from guests who already know your property, which is the specific problem vacation rental SEO for direct bookings is built to solve.
How do you leverage technology to optimize pricing and occupancy for managed Airbnb properties?
Professional revenue management combines software like PriceLabs with real-time market intelligence, adjusting rates based on local demand signals, competitor pricing, and booking pace rather than relying on a single static rate. This approach is why properties using dynamic pricing saw an average 36.3% revenue increase in the 2026 PriceLabs and Your.Rentals study cited earlier in this article.
What is a realistic revenue range for a first-year Charleston Airbnb?
A realistic first-year range for a well-positioned Charleston property sits between $55,000 and $90,000 in gross revenue, depending heavily on submarket and bedroom count, based on the range of figures reported across AirDNA, Airbtics, and AirROI. Net income after operating costs typically runs 60 to 70% of that gross figure before mortgage or financing costs.
Conclusion
How much you can make on Airbnb in Charleston in 2026 depends far less on the city-wide average and far more on your submarket, your pricing discipline, and whether you're leaving revenue on the table through static pricing. The data range, roughly $58,000 to $93,000 across different providers, gives you a starting point, but the real answer comes from modeling your specific property against submarket occupancy, licensing constraints, and realistic operating costs.
Charleston's fundamentals remain solid heading into 2026: tourism spending is growing faster than visitor volume, and occupancy and RevPAR are both climbing while active supply tightens in several submarkets due to licensing caps. That combination favors well-positioned, professionally priced properties over passive, self-managed listings coasting on default settings.
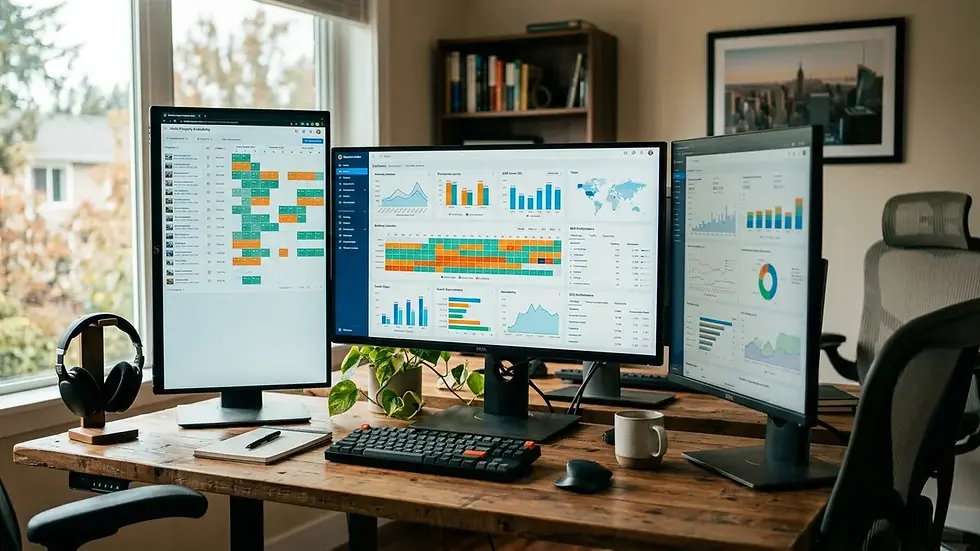
If you're trying to figure out whether your Charleston property is priced to capture its actual earning potential, get a free consultation with our team at Maverick STR. Our revenue management clients see an average 20 to 30% revenue increase using dynamic pricing tools like PriceLabs paired with real-time market intelligence, and our managed properties consistently outperform their local market by 30 to 50%. One property we took on, projected to do around $60,000 in its first year, ended up generating closer to $100,000 once we applied the right pricing and marketing strategy. Whether you need full-service Charleston management, a revenue audit, or a direct booking website that captures guests without paying OTA commissions on every stay, our team builds a plan around your specific property rather than a one-size-fits-all package.
Written by Chase Gillmore, Owner & Operator at Maverick STR
Content powered by inkSTR.co


Comments